Logging and Charts
The Azande Studio Logging and Charts window is divided into two ares:
- Logging Area
- Chart Area
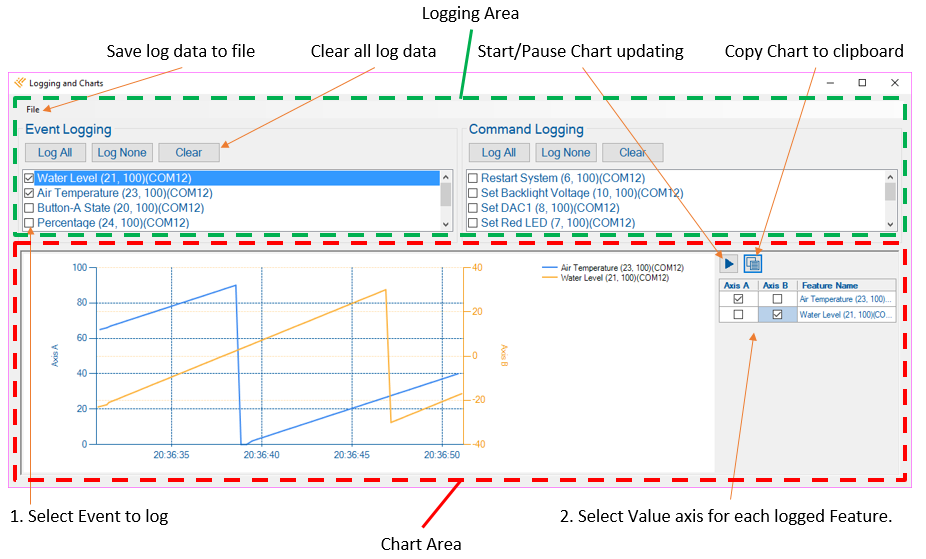
Logging Area
- In the Logging Area you will see a list of Events and a list of Commands.
- By checking the check box, next to the Feature, you will start logging.
- In the Menu File you can save your log data to a CSV-file or XML-file.
For each list of Features there are 3 buttons
Button |
Action |
Log All |
Checks all check boxes in list and start logging |
Log None |
Uncheck all check boxes and stop logging |
Clear |
Clear all Log Data. If logging activated it will restart. |
Chart Area
If you want to display a Feature in chart, you must first activate logging.
On right side of Chart Area you will see a list of active loggings.
By selecting Value-Axis A or B, the Feature will be added to the chart.
In the Chart Area you can:
- View the Live Chart
- Pause the Chart updating. Note that logging will continue in the background.
- Copy the Chart to clipboard. After copy you can past the image to your document.